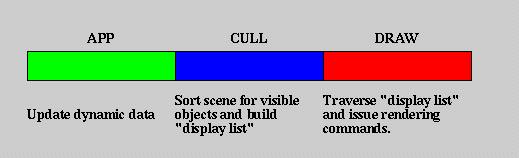
Figure 1 - The three phases of scene graph processing
(DB - Apr 28, 2004) This article was written in 2001 before the initial implementation of Producer. The concepts of multi-display management that influenced the design of Producer are discussed. While many things may have been implemented differently than discussed here, the article serves as a backdrop of the concpets within Producer.
The primary role of a scene graph is to improve performance through
culling, state sorting and various other methods, which reduce the load
on the graphics rendering engine, allowing a complex scene to be rendered
in "real time". The goal of real-time rendering is to render a scene
at frame rates high enough to meet expectations of human interaction.
Sixty Hz. or better is the goal of out-the-window image generation on
flight simulators, where anything less produces visual anomalies.
Thirty, twenty and even fifteen Hz are considered "interactive", that is,
the view is being manipulated by the user and responds within a reasonable
time of the user's input. For the purposes of this discussion, we
shall refer to frame times for a 60 Hz. simulation. Constant frame
rates and the ability of the graphics subsystem to synchronize rendering
buffer swap to vertical blanking time is assumed. Further,
systems with multiple displays assume genlock, or at least frame lock,
such that vertical retrace boundaries are synchronous across all graphics
subsystems.
The "traditional" method of using a scene graph for real-time rendering
is to use separate phases: APP, CULL, DRAW. App describes the phase
within which all dynamic user data is updated, including the position of
the camera(s), positional and attitudinal updates of moving objects.
CULL must follow APP and describes the phase whithin which the scene is
sorted by objects visible in the viewing frustum, and secondarily by state
to improve rendering performance. CULL updates camera position dependent
information, and builds a "display list" for the DRAW phase. DRAW
simply traverses the display list and issues OpenGL calls which are passed
to the graphics subsystem for processing.
Figure 1 - The three phases of scene graph processing
In a system with multiple graphics subsystems, it becomes necessary to have a CULL and DRAW phase for each, because CULL will produce unique "display lists" for each subsystem, assuming differing viewing frustums. More than a single APP is not necessary since each view will share the same dynamic data updated by the one APP phase.
Herein is defined the first requirement for multi-tasking in a system
with multiple graphics subsystems. A single processor model would
need to process the phases serially (e.g. APP, CULL_0, DRAW_0, CULL_1,
DRAW_1, CULL_2, DRAW_2), causing a frame to be as long as the aggregate
time for all phases. Two task identities can then be defined: 1)
a single APP task and 2) a CULL/DRAW task for each of the graphics subsystem.
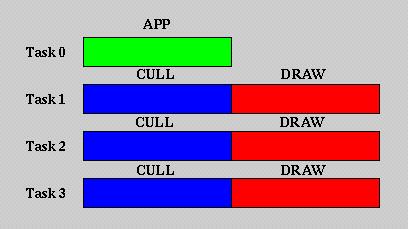
Figure 2 - Breaking the phases up into parallel tasks
for a
multi-display system
On a multiprocessor system, each of these tasks can be assigned to run in parallel on a separate processor, given enough processors. Further, the CULL/DRAW task can be split into two tasks which can run in parallel as well.
Now, two types of goals take place in a parallel multiprocessing environment. 1) Divide a large task into multiple smaller tasks that can run in parallel and reduce the processing time. Refer to this as Task Division Parallelization. and 2) Multiply a task N times and run each instance in parallel without increasing the processing time. Refer to this as Task Aggregation Parallelization. Splitting CULL/DRAW from APP, and then further, splitting CULL and DRAW into separate parallel tasks is an example of Task Division Parallelization. . Add CULL/DRAW paired tasks for each graphics subsystem is an example of Task Aggregation Parallelization..
Several issues arise when running these phases in parallel. First,
the phases must process data serially. That is,APP must finish working
on data before CULL can start using it. Likewise DRAW cannot begin
to process data generated by CULL until CULL has finished generating it.
However, APP need not wait until both CULL and DRAW are done to begin working
on the next frame of data, and thus the system is pipelined as demonstrated
in the next figure.
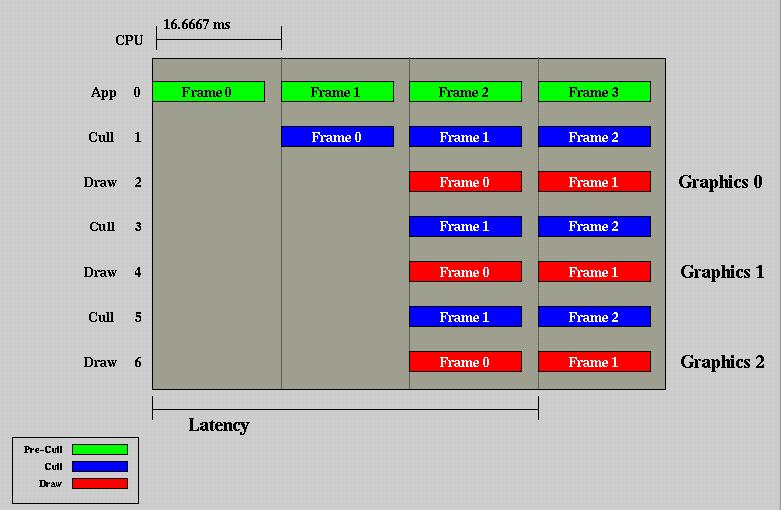
Figure 3 - The "traditional" multidisplay, multiprocessing
phase parallelization model
Further, data that is shared between phases, must be protected or buffered. Data that is being written to by an upstream phase cannot be read concurrently by a parallel phase. This introduces a large data management requirement for the scene graph software.
The above describes a framework introduced by SGI's Iris Performer in the early nineties. It was good for its time, but has become outdated for a few reasons.
Real time, out the window flight simulators that required 60 Hz frame rates held a 16.667 milliseconds as the standard time slice each phase had for completing its task. In 1990, SGI was developing real time graphics on processors that ran at 1/60th of the speed of current processors. While graphics were scaled proportionate to graphics processor capabilities, the load requirements for the APP and CULL phases has not grown at the same rate. The graph in the figure above depicts system design based on the assumption that the APP and CULL phases may take an entire frame to process.
Further, increased system bandwidths reduce the load of host-based graphics dispatch and the DRAW phase must be considered as two separate processing threads, one running on the host and the other running on the graphics subsystem. This subject will be expanded further on.
One last item of note is latency. Flight simulator requirements
often allow for a visual resonse latency of just over three frames.
While this time lapse may be founded in actual human behavior research
data, it is hard not to assume that it must comprimise the ideal
to allow for the above processing model.
Typical applications running on current hardware that consider a
60 Hz the goal for frame rate, yield processing times for Pre-CULL (previously
referred to as APP) and CULL in the range of less than 1 millisecond and
3-5 milliseconds respectively. The requirement, then, to dedicate
an entire frame, or an entire CPU to each of these phases is no longer
pertinent. The diagrams that follow will reflect these representations.
One might argue that there are expensive tasks that can be assigned to Pre-CULL and CULL to increase their run time. However, most of tasks that are typical of applications that do expensive operations are better run asynchronously to the frame driven part of the application.
Consider first, a single processor system with a single graphics subsystem. With the decreased requirement on Pre-CULL and CULL, the phase diagram might look like the following.
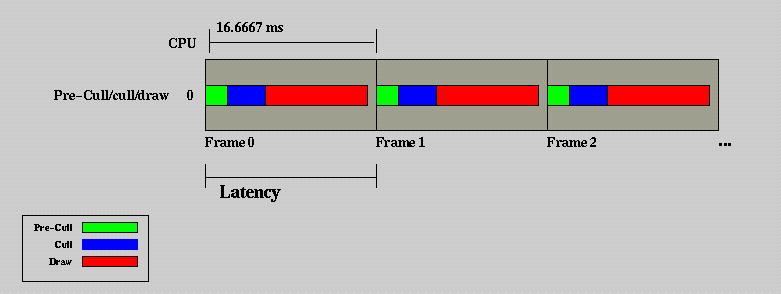
Figure 4 - Single processor, single display phase model
with pre-cull and cull processing times representative of recent computers
The good news is that all three phases are now executing in one frame, and latency is reduced to one frame The bad news is that DRAW is allocated much less time than it had before and begins drawing in the middle of the frame. The application still benefits from the use of a scene graph, since CULL wll remove all of the scene that is not visible to alleviate the host to graphics subsystem bandwidth bottleneck and wll sort objects by state changes to optimize graphics pipeline performance.
As system bandwidth and graphics performance continue to increase in capability, it may be that an application with a lifespan longer than the hardware it runs on may have no further requirements than the above. The time allocated for rendering is sufficient. In this case, no special requirements are put on the scene graph software for data protection or management.
Apply now, this model to a system with multiple graphics subsystems and multiple processors. To take advantage of the multiprocessing system, we must spawn a main thread, which will run the Pre-CULL phase, and a CULL/DRAW thread for each of the graphics subsystems. To continue, we must assume two aspects about data management:
1) Data written to by Pre-CULL, is public. andWith these two assumptions, we can now safely thread the phases as follows.
2) Data generated by CULL is internal and separate copies are made for each CULL/DRAW pair.
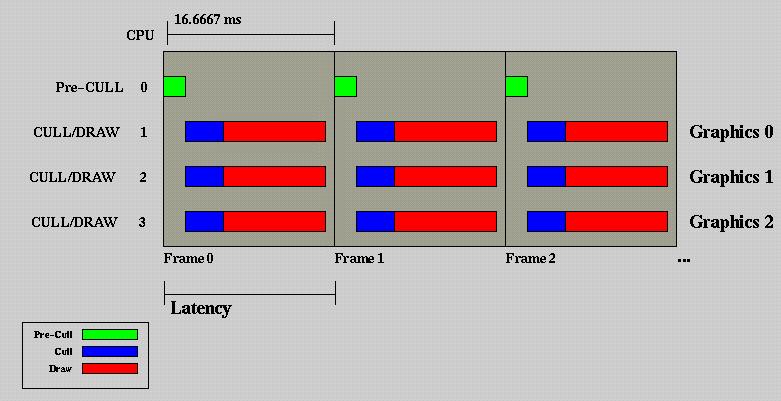
Figure 5 - Multithreaded phase model for multidisplay
system
We have solved the problem of Task Aggregation Parallelization, but have not solved the issue of having a DRAW phase that is significantly shorter than a full frame. To accomplish this, we must break CULL and DRAW up into their own process threads. This will require protecting or buffering data that is generated by CULL and read and processed by DRAW. This subject is discussed in folowing sections. The phase diagram follows.
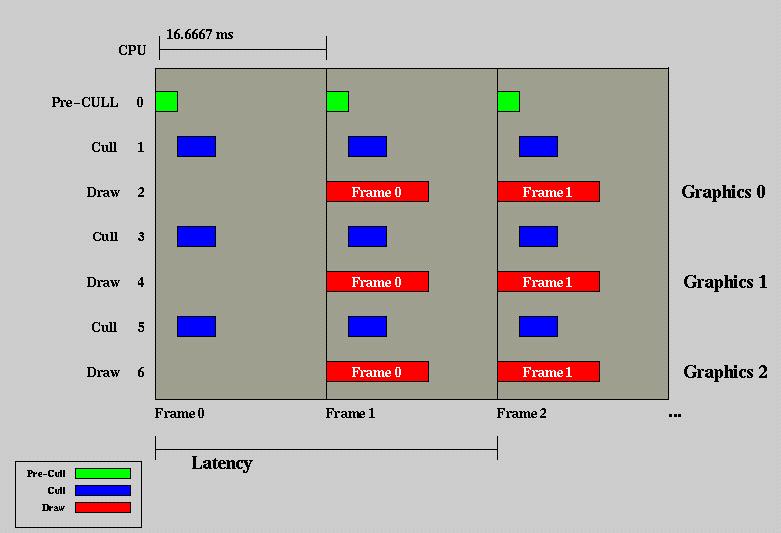
Figure 6 - Multithreaded phase model for multidisplay
system with CULL and DRAW as separate threads
If you are a hardware vendor, this is a beautiful diagram because it
represents 7 CPUS being used to drive three graphics subsystems.
A simple argument about reserving CPU 0 for operating system tasks and
starting the simulation tasks with CPU 1 will sell an eighth CPU.
However, as an engineer, it is hard not to notice a lot of empty
space in the diagram. Note also, that we've increased latency by
a frame. This is still significantly better than the three frame
latency of the old model, however.
Look closely at the run-time lapse of host-based DRAW (also referred
to as Dispatch), and graphics subsystem DRAW depicted in the following
diagram.
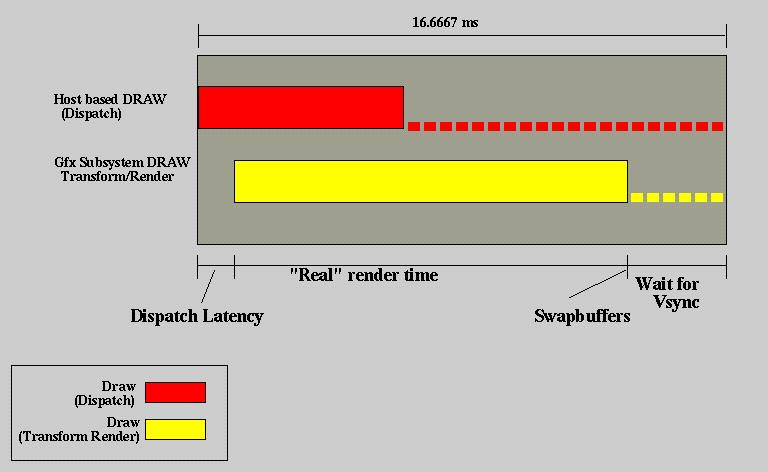
Figure 7 - DRAW as represented by dispatch and substyem
processing
This diagram represents one frame of time, with host based DRAW (Dispatch) starting on the frame boundary. The period of time that occurs between when host DRAW begins dispatching OpenGL calls and the graphics subsystem begins processing these can be referred to as Dispatch latency. The yellow band represent the time it takes for the graphics subsystem to completely process the input stream, finish the transform phase, the render phase and issue a rendering buffer swap. Since buffer swap does not occur until the next vertical retrace blanking time, the graphics subsystem waits.
Note, however that DRAW Dispatch has finished well ahead of the graphics subsystem processing. In the interest of synchronizing the application with the graphics subsystem, most serious graphics software will wait also for a signal indicating that buffer swap has occured before going on to the next frame. This presents an opportunity for processing time on the host.
With this knowledge in hand, considering the parallel nature of host
and graphics, we can apply the following phase model.
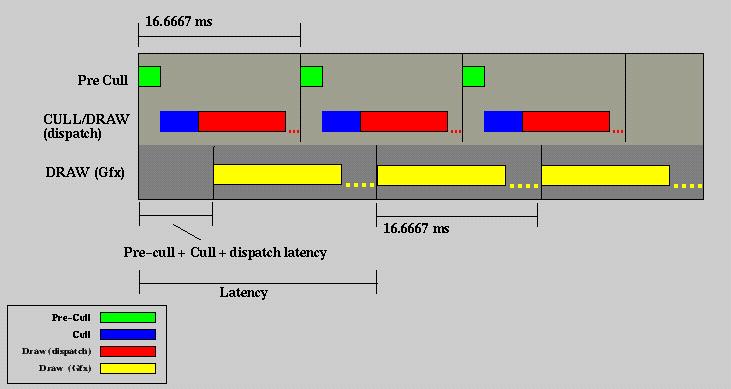
Figure 8 - Phase shifted processing model
In this model we run the host based frame scheduler at the precise rate of the graphics subsystem vertical retrace signal. However we stagger it to be slightly out of phase such that we can begin a frame on the host sometime before vertical retrace. We finish the Pre-CULL phase and the CULL phase and begin to issue OpenGL protocol from host based DRAW such that when vertical retrace occurs and graphics subsystem processing resumes, it begins as close to graphics subystem frame boundaries as possible. Note that CULL and DRAW (dispatch) reside in the same thread and are processed serially. This is a result of taking advantage of time wasted in the host waiting for vertical retrace.
This model simplifies memory management within the scene graph, takes
better advantage of compute resources and allows maximum rendering time
for graphics DRAW. Note also, that latency is down to less than two
frames.
The Open Scene Graph Multi Processor model begins with the following
diagram.
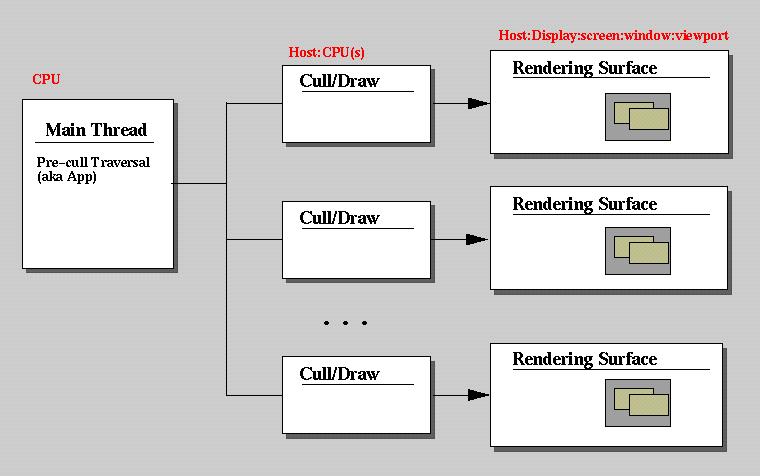
The blocks in the diagram represent abstract concepts and should not
be bound too closely to hardware or implementation at first glance.
The implementation will be derived as the discussion ensues. Letters
in red represent designations to be used in a configuration document or
implementation. Lines and arrows represent the flow of data as it
goes through the system and ends up rendered on a display.
The Main Thread is the process or thread that runs Pre-CULL.
Its declaration in the configuration will include a CPU upon which to run
it. It will be assumed that the Main Thread will run from the host
where it is invoked. A configuration manager may be implemented to
start and initialize each block above, and the Main Thread will run from
the same host the manager is run from.
Cull/Draw pairs may run as a single thread, or separate threads
depending on the processing model chosen from the previous section.
These can be designated with a Host argument defining the hostname
of the system they should run on, and a CPU argument defining numerically
what CPU on the designated host to schedule them on. If CPU is plural
(not greater than 2), it is assumed that Cull/Draw will run as separate
threads.
The Rendering Surface represents the screen space where the final
rendering will be displayed. Its designation defines
|
|
Hostname of the system where display will be seen |
|
|
Graphics subsystem. Display is used here as it is in theXWindow system. |
|
|
Screen is used as it is in the XWindow system. |
|
|
Window is used as it is in the XWindow system. |
|
|
Viewport is the rectangle within the Window the final rendering will be confined to. |
Note that the above can be configured to run in three separate environments.
1) Single System Image
If the Host field in designations remains constant the system will be initialized on the same host. Threads can then be configured to run where the CPU field is defined in their designations.
2) Graphics Cluster
If the Host field differs on the Cull/Draw pair than the Pre-cull host, then a Pre-cull agent will be started on the Cull/Draw pair host, and used to synchronize dynamic data set within the Pre-cull phase on the slave host. This agent will block the Cull phase until data is synchronized.
3) Wire GL configurations
Note that Rendering Surfaces contain a "Host' field in their designation. This could be used to implement a WireGL implementation to handle the OpenGL protocol issued from the host-based DRAW phase.
The flexibility of this configuration scheme allows for a mix-and-match
of the above configurations. For example, an application could run
its out-the-window display on three local graphics subsystems, provide
multiple clustered displays for an Instructor Operator Station, and implement
a final composite of all displays on a WireGL cluster.
Still, both methods are discussed here for consideration.
Consider the following MP model introduced in the previous section.
We deal here with a single, host based Pre-CULL/CULL/DRAW pipeline, with
the understanding that multiple Cull/Draw pairs can be extrapolated from
the information.
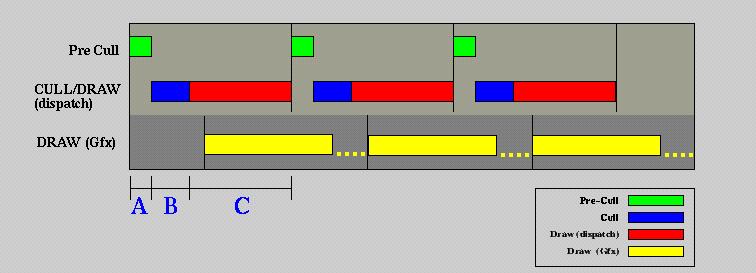
This model assumes a host-based staggered frame scheduler, and a single thread for CULL/DRAW. Time lapses A, B, and C represent the data flow stages in the next diagram.
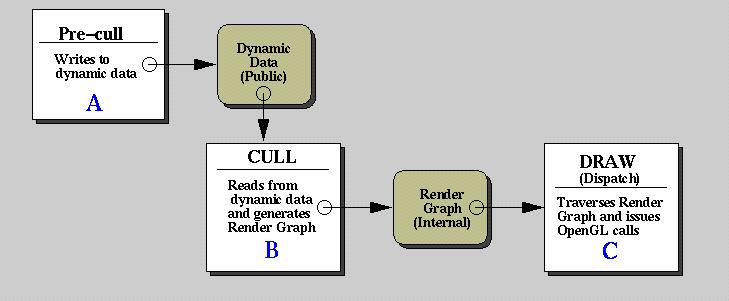
As previously stated, the Pre-CULL phase updates dynamic data in the scene graph. This dynamic data includes camera position(s), position of moving objects within the scene, update of timestamps, frame counts, elapsed time, and other data management facilities, etc. This data is assumed to be public, allocated and accessible by the application. Thus, CULL must wait until Pre-CULL has finished its phase. Once Pre-CULL is done, it signals CULL to run. CULL reads the updated dynamic data, and generates internal data, not accessible by the application, but intended only for the DRAW phase. This data is processed serially. DRAW traverses the generated data and issues OpenGL calls.
This model is simple and requires little more than simply implementing the run-time including the phase shifted host based frame scheduler. OpenSceneGraph already contains support for multiple rendering contexts on a multi-display system. No changes are required in Cull/Draw to run them as a single thread.
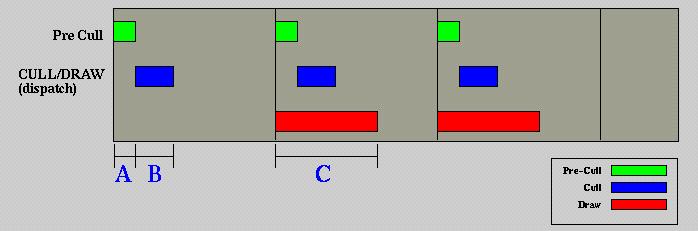
Data for this model is depicted in the following diagram.
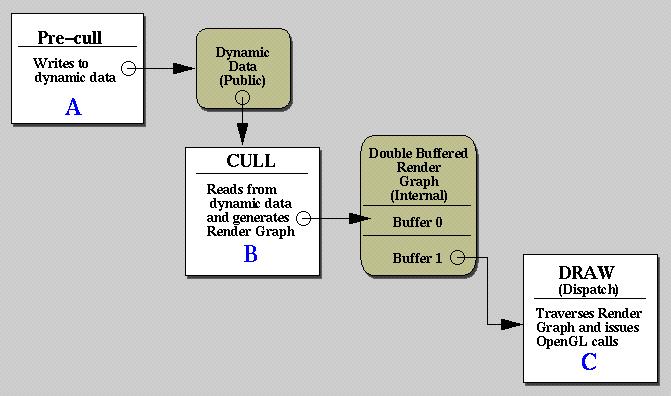
This diagram differs from the single threaded CULL/DRAW diagram in that the internal data that is passed from CULL to DRAW must be double buffered. Data generated by CULL will be written to Buffer 0 while DRAW reads from Buffer 1. At a synchronization point between CULL and DRAW, pointers to the Buffers can be swapped.
This approach requires the implementation of the double buffered internal
data, and the implementation of a synchronization point between CULL and
DRAW.
OpenSceneGraph is architected for successful multi-tasking, multi-processing
and multi-displays. The implementation approach is modern and takes
advantage of current hardware. Open Scene Graph has been tested successfully
under SGI's MPK, and has held up well. It is the desire of the Open
Scene Graph authors to implement a solution that is cross-platform and
allows the flexibility to run transparently on graphics clusters.
Given the building blocks the implementation of multi-display, multi-processing
run time for Open Scene Graph is only slightly more than trivial.